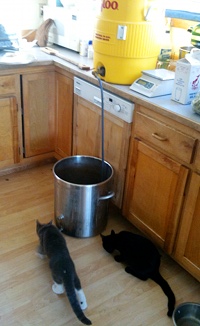
I took Friday off from work and brewed my first batch of beer in quite a long time. It’s a brown porter named Crazy Kittens Porter. As should be obvious, it’s named after our three crazy kittens Caslon, Tallys and Jenson, pictured on the right. This time around I developed the recipe using the BrewPal iPhone app, trusting all the measurements and temperatures to the app. We’ll see how well it does. My favorite part of the app is the “style” tab, which shows you what styles your recipe conforms to and to what degree.
Normally I do everything out in the red cabin, but I had the wood stove cranking so I heated the strike and spare water on the wood stove and drained the mash in the kitchen (shown below). It was nice to be able to do that stuff in the house and to avoid burning fossil fuels for the wort production. As usual, I boiled and chilled the wort outside and set the fermenter in the old fridge out in the red cabin. It’s bubbling away now.
I plan to brew another batch of Devil Dog on top of the yeast cake from this batch. This is an excellent way to save some money on yeast, and the second batch normally gets a very explosive start from the massive population of healthy yeast.
Today I went for a walk on the Creek with Nika and Piper and it occurred to me that the iPhone ought to be able to tell me not only where I am (which it does quite well with the Google-driven map application), but on whose property I’m walking through. It took me a little time, but I now have a webapp (http://swingleydev.com/gis/loc.html) that can do this (don't bother clicking on the link unless you're on an iPhone or other GPS-enabled device).
The result is a pair of pages. The first one shows you your current location, speed, and heading. With a press of a button (and a delay while the database finds the property owner) you can see the Borough information on the property you’re currently inside (assuming you’re in the Fairbanks North Star Borough—this page doesn’t do non-Borough residents any good).
Here’s how I set it up:
My web hosting provider doesn’t have a new enough version of PostgreSQL to run PostGIS, which means I need to use the spatially-enabled version of SQLite3, called Spatialite. To get the parcel database from the shapefile to Spatialite requires the following steps. Some parcels are eliminated in this process, but it’s a small fraction of the parcels in the database:
Download the parcels shapefile:
$ wget ftp://co.fairbanks.ak.us/GIS/tax_parcels.zip
Unzip it and insert it into a spatially enabled PostgreSQL database using ogr2ogr. Crash the process immediately:
$ unzip tax_parcels.zip
$ ogr2ogr -f "PostgreSQL"
    -t_srs EPSG:4326
    -overwrite -skipfailures
    PG:"dbname='test'"
    tax_parcels.shp
Fix the column definitions:
sql> DELETE FROM tax_parcels;
sql> ALTER TABLE tax_parcels ALTER COLUMN
    sqft_calc TYPE numeric (22,12);
Re-import the data:
$ ogr2ogr -f "PostgreSQL"
    -t_srs EPSG:4326
    -append -skipfailures
    PG:"dbname='test'"
    tax_parcels.shp
Convert the geometry column to MULTIPOLYGON:
sql> ALTER TABLE tax_parcels DROP CONSTRAINT "enforce_geotype_wkb_geometry";
sql> ALTER TABLE tax_parcels ADD CONSTRAINT "enforce_geotype_wkb_geometry"
     CHECK (geometrytype(wkb_geometry) = 'MULTIPOLYGON'::text OR
            wkb_geometry IS NULL OR
            geometrytype(wkb_geometry) = 'POLYGON'::text);
sql> UPDATE tax_parcels SET wkb_geometry = ST_Multi(wkb_geometry);
sql> ALTER TABLE tax_parcels DROP CONSTRAINT "enforce_geotype_wkb_geometry";
sql> ALTER TABLE tax_parcels ADD CONSTRAINT "enforce_geotype_wkb_geometry"
     CHECK (geometrytype(wkb_geometry) = 'MULTIPOLYGON'::text OR
            wkb_geometry IS NULL);
sql> UPDATE geometry_columns SET type='MULTIPOLYGON'
     WHERE f_table_name='tax_parcels' AND f_geometry_column='wkb_geometry';
Re-import the data (there will be thousands of errors, but this insert should add the MULTIPOLYGON rows that weren’t inserted the first time around):
$ ogr2ogr -f "PostgreSQL"
    -t_srs EPSG:4326
    -append -skipfailures
    PG:"dbname='test'"
    tax_parcels.shp
Get rid of the illegal polygons:
sql> DELETE FROM tax_parcels WHERE NOT ST_IsValid(wkb_geometry);
Convert to spatialite:
$ ogr2ogr -f "SQLite"
    tax_parcels.sqlite
    PG:"dbname='test'"
    -dsco SPATIALITE=YES
With the data in the proper format, I built a mobile web page that can pull location information from the mobile device, display it on the screen, and pass this information to a page that finds and displays the parcel information from the Spatialite database. JavaScript handles gathering the location information, but because I don’t control the web server, I had to write a CGI script to pass a query to spatialite and format the results as a list. This CGI is called by the main page from a <form> element. The spatialite query looks like this:
sqlite> SELECT street_add, owner_firs, owner_last,
           owner1, owner2, owner3, mail_add, ci_st_zip,
           round(acres_calc, 1) as acres, ’$’ || total as total,
           ’$’ || land as land, ’$’ || improvemen as improvements,
           pan, sub, block, lot, road_water, lot_size, units,
           neighborho, primary_us, tax_status, tax_year, mill_rate,
           business, year_built, situs_numb, situs_name
        FROM tax_parcels
        WHERE Intersects(GEOMETRY, SetSRID(MakePoint(lon, lat), 4326));
Again, implementing this would be a lot easier if I could install PostGIS on the server and use PHP to access the data directly. Because I can’t, spatialite and CGI do the trick.
Update: I added a few more steps to convert the initially imported POLYGON layers to MULTIPOLYGON, which then allows us to include the MULTIPOLYGON rows from the shapefile.

Drawing my bow
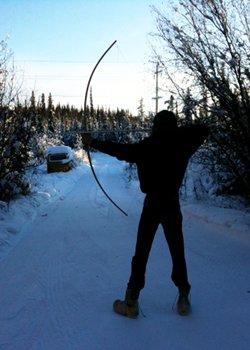
Today I made a bow from a board. I started with a 1x3 piece of red oak, and ended up with the bow seen in silhouette in the photo on the right. It’s an American flatbow, similar to what many Native American tribes (including some Inuit) used. In mine, the upper and lower limbs don’t have quite the same shape and it has a lower draw weight than I had planned on, but I think it was a good first attempt at bow-making.
The hardest part is finding a board that has straight grain lines running all the way down the face of the board. You cut and smooth the sides first (it’s about 1½” wide at the handle and gently tapers to ½” at the tips) then begin tapering the limbs (full thickness at the handle, gently tapering to ½” at the tips). After each thinning the bow is drawn slightly further up a tillering board (a piece of wood with notches cut into it to hold the string) and the shape is evaluated to make sure it’s bending the way you want. My mistake was in thinning the wrong limb too much without making similar changes to the other half of the bow. Once I realized this, I had to remove a bunch of material off the now-thicker limb and wound up with a bow that is easier to draw than intended. Since I haven’t actually shot an arrow from a bow since high school, a light drawing bow is probably a good idea until I’m ready for something more powerful. This one is reasonably easy for me to pull, and shoots sticks very smoothly.
Tools used: I used a rip saw to cut the board to rough dimension, smoothed the saw cuts with a wooden jack plane, made the initial taper with a drawknife, and did the majority of the remaining adjustments with a coffin smoother, an adjustable mouth block plane and a handled cabinet scraper. Probably should have used the scraper more and the hand planes less. Volumes 1 and 4 of The Traditional Bowyer’s Bible were invaluable, and I think I could have used the other two volumes too, if I’d had them. There’s a ton of information in those books for both the beginner, and advanced bowyer. In addition to volumes 2 and 3, I need some real arrows, a target, and more wood for more bows!
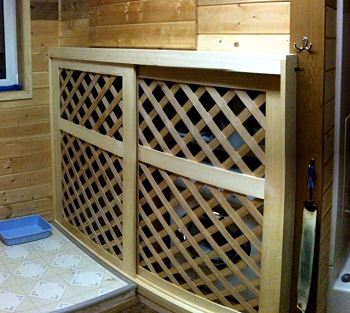
We’ve been wanting to let the kittens into the rest of the house for several weeks now, but when we got close to letting them downstairs we realized they could get into all sorts of trouble in the utility area in the bathroom where the water heater, pump, and washing machine are. Worse, if they got in there, they could climb around behind the shower and tub surround and we’d have no way of getting them out.
So I built the doors you can see in the photo. They’re made from clear pine. I’d originally planned on using “pocket-screw technology,” on the doors, but when driving the pocket screws from the back of the rails into the styles, they cracked the styles. I wound up using glue and dowels instead, and they seem solid. I was a little worried because the doors were so large, but they’re flat and slide easily in the tracks I made.
The image looks a little warped because it's a series of photos that are joined together using the AutoStitch iPhone app. It's a pretty good alternative when you don't have a wide angle lens.
Today was the first day the kittens came downstairs (except once when Jenson escaped), and things seemed to go well. Nika and Piper have been spending nights with all of us, so they’re used to the kittens. Buddy and Deuce mostly seemed afraid. Koidern and Kiva were both very interested, and spent the whole time cautiously following the kittens around. After an hour or so we put the kittens back upstairs to let everyone relax. I opened up the gates again this afternoon and captured this video of Kiva’s interaction with Tallys (and a little of Jenson). Tallys is the one rolling around on the floor in front of the heater, seemingly trying to play with Kiva’s feet.
The music (which was playing on the stereo as I recorded the video on my iPhone) is from Four Tet's latest record.
I recently saw a pair of blog posts showing how to make heatmaps with straight R and with ggplot2. Basketball doesn’t really interest me, so I figured I’d attempt to do the same thing for the 2010 Oakland Athletics 40-man roster. Results are at the bottom of the post.
First, I needed to get the 40-man roster:
$ w3m -dump "http://oakland.athletics.mlb.com/team/roster_40man.jsp?c_id=oak" > 40man
Then trim it down so it’s just a listing of the player’s names.
Next, get the baseball data bank (BDB) database from http://baseball-databank.org/, convert and insert it into a PostgreSQL database using mysql2pgsql.perl.
A Python script reads the names from the roster, and dumps a CSV file of the batting and pitching data for the past two seasons for the players passed in.
$ cat 40man_names | ./get_two-year_batter_stats.py
The batting data looks like this:
            name  , age,   g,    ba,   obp,   slg,   ops,  rc,   hrr,    kr,   bbr
Daric Barton (1B) ,  25, 194, 0.238, 0.342, 0.365, 0.707,  73, 0.017, 0.173, 0.134
Travis Buck (RF)  ,  27,  74, 0.223, 0.289, 0.392, 0.682,  28, 0.035, 0.202, 0.073
Chris Carter (LF) ,  28,  13, 0.261, 0.320, 0.261, 0.581,   1, 0.000, 0.360, 0.080
...
I’ve used the counting stats in the BDB to calculate batting average (ba), on-base percentage (obp), slugging percentage (slg), OPS (on-base percentage + slugging percentage), runs created (rc), home run rate (hrr), strikeout rate (kr) and walks rate (bbr).
And the pitching data:
            name   , age,  g,      ip,  w, l,    sv,    wp,    lp,    wf,   era,    k9,   bb9,   hr9
Brett Anderson (P) ,  22,  30, 175.33, 11,  11,   0,  0.37,  0.37,  0.00,  4.06,  7.70,  2.36,  1.03
Andrew Bailey (P)  ,  26,  68,  83.33,  6,   3,  26,  0.09,  0.04,  0.04,  1.84,  9.83,  2.92,  0.54
Jerry Blevins (P)  ,  27,  56,  60.00,  1,   3,   0,  0.02,  0.05, -0.04,  3.75,  8.70,  3.30,  0.60
...
Here I’ve calculated innings pitched (ip), winning percentage (wp), losing percentage (lp), win frequency (wf), earned run average (era), strikeouts per nine innings (k9), walks per nine (bb9), and home runs given up per nine innings (hr9). All these stats are for the last two Major League seasons.
Finally, generate the heat maps in R. For batting statistics:
library(ggplot2)
mlb <- read.csv('batting.csv')
mlb$name <- with(mlb, reorder(name, ops))
mlb.m <- melt(mlb)
mlb.m <- ddply(mlb.m, .(variable), transform, rescale = rescale(value))
(p <- ggplot(mlb.m, aes(variable, name)) +
+   geom_tile(aes(fill = rescale), colour = "white") +
+   scale_fill_gradient(low = "gold", high = "darkgreen"))
base_size <- 14
p + theme_grey(base_size = base_size) + labs(x = "", y = "") +
+   scale_x_discrete(expand = c(0, 0)) + scale_y_discrete(expand = c(0, 0)) +
+   opts(legend.position = "none", axis.ticks = theme_blank(),
+   axis.text.x = theme_text(size = base_size * 0.8, angle = 0, hjust = 0.5, colour = "black"),
+   axis.text.y = theme_text(size = base_size * 0.8, lineheight = 0.9, colour="black", hjust = 1))
Pitching statistics are the same, except the third line (where I order the data frame) is:
mlb$name <- with(mlb, reorder(name, 1/(era+0.1)))
The results:
A’s batting heatmap, ordered by OPS

A’s pitching heatmap, ordered by ERA

You have to keep the number of games (or innings pitched for pitchers) in mind when you look at these charts. I don’t even know who some of those guys are, probably because they’ve only barely played in the majors. It might make some sense to split the pitching plot into plots for starters and relievers, but I’d need a good way to determine a pitcher’s status (innings pitched divided by games beyond some threshold, perhaps?).
As for the A’s, I like their pitching, but have serious doubts about their offense. I sure hope some of the younger guys on this chart start reaching their power potential because having Jack Cust as your only offensive weapon doesn’t bode well for the team scoring runs.


