Yearly Minimum Temperature

climate
R
temperature
Published

January 20, 2024

Chilly Buns Run, 2024-01-20, UAF

It has felt like a fairly mild winter this year in Fairbanks, and a look at the 12-month temperature anomaly plot shows a lot of reddish days, especially in November and January. December was fairly normal, without any extremes in either direction.

Temperature anomaly plot

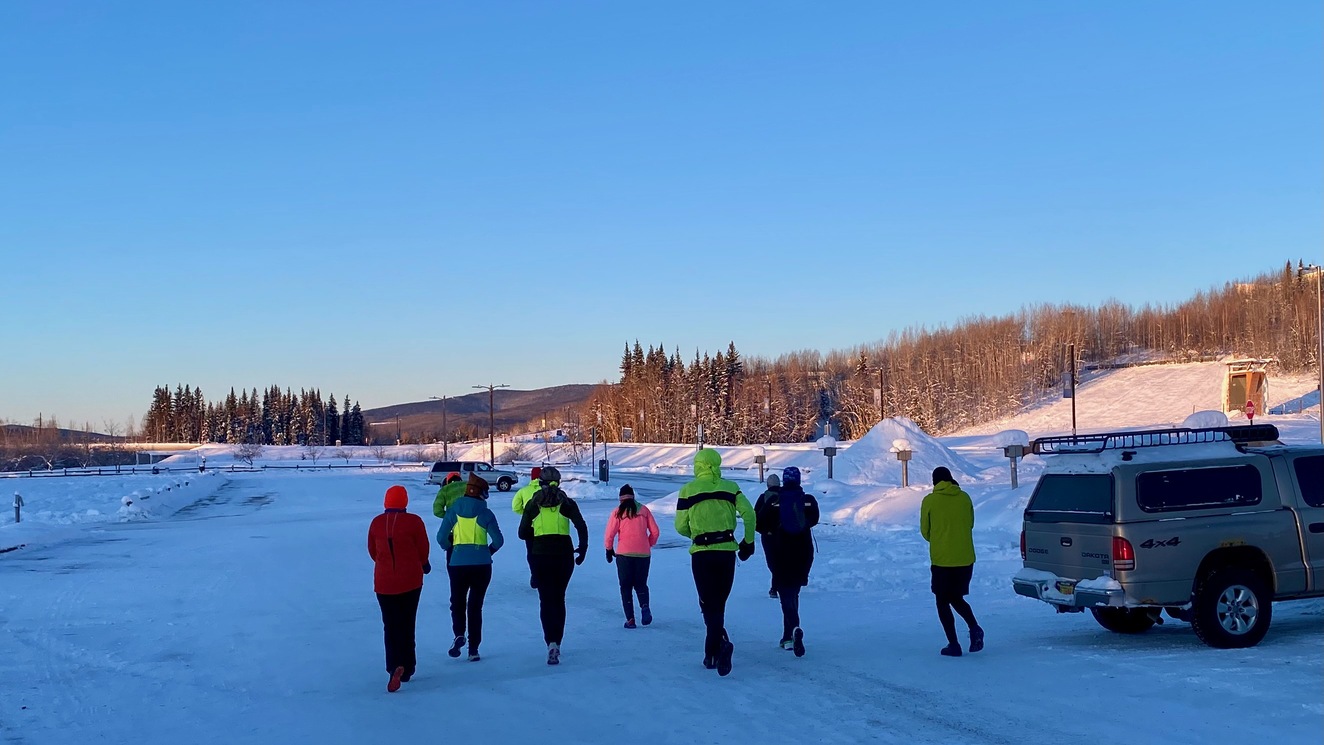
Earlier in the week there was a Special Weather Statement from the National Weather Service office in Fairbanks, warning of a long cold snap, with temperatures -40 and colder expected tomorrow and into next week. We are typically colder than the airport at our house and we’ve been living here for fifteen years, so I thought I’d look at what the yearly minimum temperatures have been since we moved here.

Here’s a table showing the minimum temperatures at our house and at the Fairbanks Airport and the date (or dates) that temperature was recorded in each winter.

Code
library(tidyverse)
library(lubridate)
library(glue)
library(fs)
library(gt)

yearly_minimum <- read_csv("dw1454_yearly_minimum.csv")
pafa_yearly_minimum <- read_csv("pafa_yearly_minimum.csv")

home_airport_min <- yearly_minimum |>
  group_by(winter_year) |>
  summarize(
    dte = paste(dte, collapse = ", "),
    min_west_temp = min(min_west_temp)
  ) |>
  select(winter_year, home_date = dte, home_min_temp = min_west_temp) |>
  inner_join(
    pafa_yearly_minimum |>
      filter(winter_year >= 2009) |>
      group_by(winter_year) |>
      summarize(pafa_min_temp = min(pafa_min_temp)) |>
      select(winter_year, pafa_min_temp),
    by = "winter_year"
  )

home_airport_min |>
  arrange(winter_year) |>
  # mutate(winter_year = glue("{winter_year}‒{winter_year + 1}")) |>
  select(home_date, home_min_temp, pafa_min_temp) |>
  gt() |>
  cols_align(align = "left", columns = home_date) |>
  cols_label(
    home_date = "Date",
    home_min_temp = "Minimum Temperature (° F)",
    pafa_min_temp = "Airport Minimum (° F)"
  ) |>
  fmt_number(
    decimals = 1
  ) |>
  tab_style(
    style = list(
      cell_fill(color = "lightcyan"),
      cell_text(weight = "bold")
    ),
    locations = cells_body(
      rows = home_min_temp < -50
    )
  ) |>
  tab_style(
    style = list(
      cell_fill(color = "lightpink"),
      cell_text(weight = "bold")
    ),
    locations = cells_body(
      rows = home_min_temp > -30
    )
  ) |>
  tab_header(
    title = "Minimum Temperature by Winter Year",
    subtitle = "Home, Fairbanks airport stations"
  )
Minimum Temperature by Winter Year
Home, Fairbanks airport stations
Date Minimum Temperature (° F) Airport Minimum (° F)
2010-01-12 −43.4 −41.1
2011-01-23 −42.2 −44.0
2012-01-29 −53.3 −51.0
2013-01-28 −47.6 −47.9
2013-12-26 −42.4 −40.9
2015-02-07 −43.4 −42.9
2015-11-19 −29.7 −28.8
2017-01-18 −51.3 −50.8
2018-01-29, 2018-01-26 −31.5 −32.8
2019-01-12 −44.3 −43.8
2020-02-15 −42.7 −42.9
2021-02-09 −42.1 −41.8
2022-01-02 −43.9 −46.8
2022-12-20 −43.7 −38.9
2024-01-20, 2023-12-15 −31.2 −29.7

I’ve highlighted the winters where we got colder than -50° F and where we never even got to -30° F. This winter we got to -31.2 today and also back on December 15th. It seemed like it was going to be a cold Chilly Buns Run, but the temperature on campus at the start of the race was closer to -24° F, and it warmed up rapidly during the race.

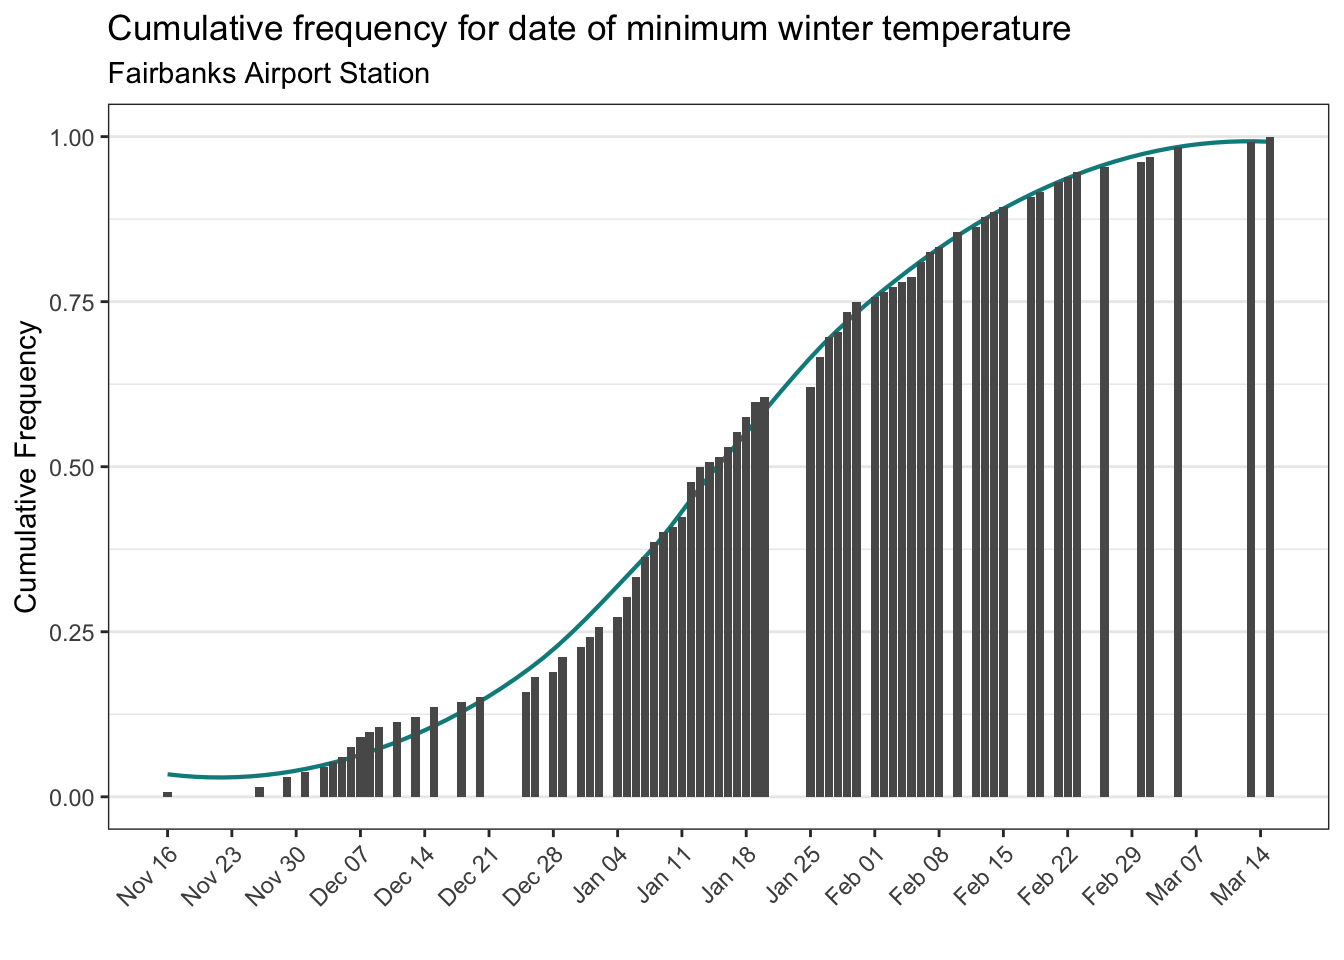
When do we normally hit the minimum temperature during the winter? The following plot shows when during the winter we’re most likely to have gotten our coldest temperature.

Code
yearly_minimum_doy <- pafa_yearly_minimum |>
  mutate(doy = yday(dte))

get_2024_date <- function(doy, format = "%b %d") {
  dte <- ymd("2023-01-01") + days(doy - 1)

  return(format(dte, format))
}

doy_cum_freq <- yearly_minimum_doy |>
  mutate(plot_doy = if_else(doy < 91, doy + 365, doy)) |>
  count(plot_doy) |>
  arrange(plot_doy) |>
  mutate(
    freq = n/nrow(pafa_yearly_minimum),
    cum_freq = cumsum(freq)
  )

ggplot(
  data = doy_cum_freq,
  aes(x = plot_doy, y = cum_freq)
) +
  theme_bw() +
  geom_smooth(
    se = FALSE, 
    linewidth = 0.75, 
    color = "darkcyan"
  ) +
  geom_bar(stat = "identity") +
  scale_x_continuous(
    name = "",
    breaks = seq(320, 440, 7),
    labels = get_2024_date
  ) +
  scale_y_continuous(
    name = "Cumulative Frequency"
  ) +
  theme(
    axis.text.x = element_text(angle = 45, hjust = 1, vjust = 1),
    panel.grid.major.x = element_blank(),
    panel.grid.minor.x = element_blank()
  ) +
  labs(
    title = "Cumulative frequency for date of minimum winter temperature",
    subtitle = "Fairbanks Airport Station"
  )

This is a cumulative frequency plot, so it shows how likely it is for the minimum temperature to have happened by the date on the x-axis. So in half all the years in the temperature record at the Fairbanks Airport, the minimum temperature for the winter year has happened by January 14th. On today’s date, there’s still a 39% chance we’ll see a temperature colder than today’s minimum of -31.2° F.

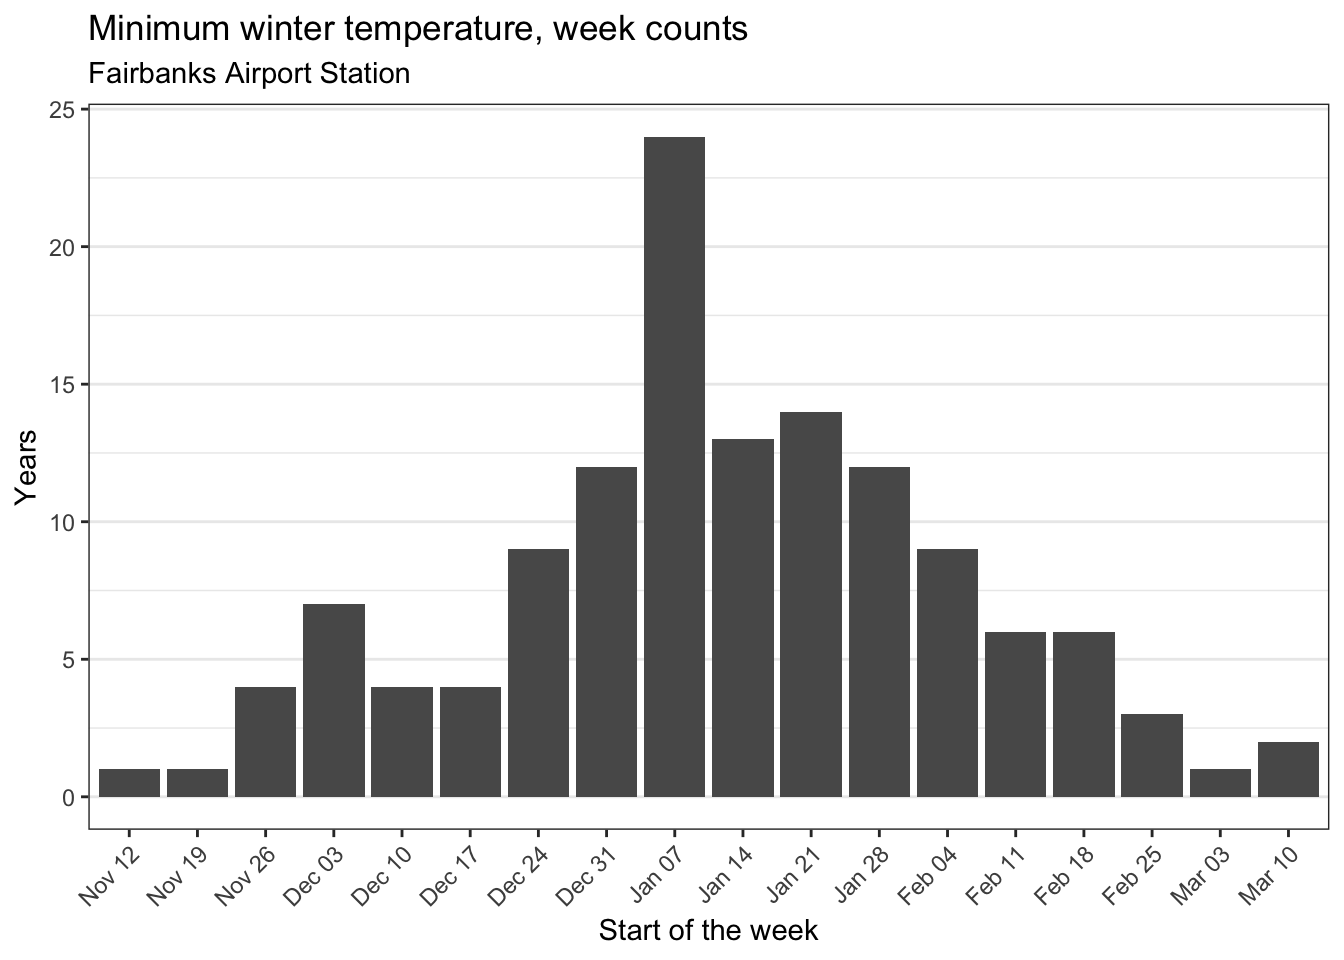
A more traditional way of looking at this sort of data is to just plot the count of years on the date (or week) when the minimum temperature happened. That plot looks like this.

Code
yearly_minimum_week <- pafa_yearly_minimum |>
  mutate(week = isoweek(dte))

get_2024_start_date <- function(week, format = "%b %d") {
  week <- as.integer(week)
  dte <- ymd("2023-01-01") + weeks(week - 1)

  return(format(dte, format))
}

week_counts <- yearly_minimum_week |>
  mutate(plot_week = if_else(week < 20, week + 52, week)) |>
  count(plot_week) |>
  arrange(plot_week)

ggplot(
  data = week_counts,
  aes(x = as.factor(plot_week), y = n)
) +
  theme_bw() +
  geom_bar(stat = "identity") +
  scale_x_discrete(
    name = "Start of the week",
    labels = get_2024_start_date
  ) +
  scale_y_continuous(
    name = "Years"
  ) +
  theme(
    axis.text.x = element_text(angle = 45, hjust = 1, vjust = 1),
    panel.grid.major.x = element_blank(),
    panel.grid.minor.x = element_blank()
  ) +
  labs(
    title = "Minimum winter temperature, week counts",
    subtitle = "Fairbanks Airport Station"
  )

I’m not sure why the second week of January is so much higher than the surrounding weeks. Back in 2017 I looked at the frequency of temperatures colder than -15 and -40° F and the pattern is similar, with a peak just before the middle of January. Here’s the plot for -15° F and colder from that post:

Frequency of -15° F temperatures