Back cabin
I’ve read predictions that this winter will be a strong La Niña period, which means that the tropical eastern Pacific Ocean temperature will be colder than normal. The National Weather Service has a lot of information on how this might affect the lower 48 states, but the only thing I’ve heard about how this might affect Fairbanks is that we can expect colder than normal temperatures. The last few years we’ve had below normal snowfall, and I was curious to find out whether La Niña might increase our chances of a normal or above-normal snow year.
Historical data for the ocean temperature anomaly are available from the Climate Prediction Center. That page has a table of “Oceanic Niño Index” (ONI) for 1950 to 2010 organized in three-month averages. El Niño periods (warmer ocean temperatures) correspond to a positive ONI, and La Niña periods are negative. I’ve got historical temperature, precipitation, and snow data for the Fairbanks International Airport over the same period from the “Surface Data, Daily” or SOD database that the National Climate Data Center maintains.
First, I downloaded the ONI index data, and wrote a short Python script that pulls apart the HTML table and dumps it into a SQLite3 database table as:
sqlite> CREATE TABLE nino_index (year integer, month integer, value real);
Next, I aggregated the Fairbanks daily data into the same (year, month) format and stuck the result into the SQLite3 database so I could join the two data sets together. Here’s the SOD query to extract and aggregate the data:
pgsql> SELECT extract(year from obs_dte) AS year, extract(month from obs_dte) AS month,
            avg(t_min) AS t_min, avg(t_max) AS t_max, avg((t_min + t_max) / 2.0) AS t_avg,
            avg(precip) AS precip, avg(snow) AS snow
       FROM sod_obs
       WHERE sod_id=’502968-26411’ AND obs_dte >= ’1950-01-01’
       GROUP BY year, month
       ORDER BY year, month;
Now we fire up R and see what we can find out. Here are the statements used to aggregate October through March data into a “winter year” and load it into an R data frame:
R> library(RSQLite)
R> drv = dbDriver("SQLite")
R> con <- dbConnect(drv, dbname = "nino_nina.sqlite3")
R> result <- dbGetQuery(con,
        "SELECT CASE WHEN n.month IN (1, 2, 3) THEN n.year - 1 ELSE n.year END AS winter_year,
                avg(n.value) AS nino_index, avg(w.t_min) AS t_min, avg(w.t_max) AS t_max, avg(w.t_avg) AS t_avg,
                avg(w.precip) AS precip, avg(w.snow) AS snow
         FROM nino_index AS n
            INNER JOIN noaa_fairbanks AS w ON n.year = w.year AND n.month = w.month
         WHERE n.month IN (10, 11, 12, 1, 2, 3)
         GROUP BY CASE WHEN n.month IN (1, 2, 3) THEN n.year - 1 ELSE n.year END
         ORDER BY n.year;"
   )
What I’m interested in finding out is how much of the variation in winter snowfall can be explained by the variation in Oceanic Niño Index (nino_index in the data frame). Since it seems as though there has been a general trend of decreasing snow over the years, I include winter year in the analysis:
R> model <- lm(snow ~ winter_year + nino_index, data = result)
R> summary(model)

Call:
lm(formula = snow ~ winter_year, data = result)

Residuals:
      Min        1Q    Median        3Q       Max
-0.240438 -0.105927 -0.007713  0.052905  0.473223

Coefficients:
              Estimate Std. Error t value Pr(>|t|)
(Intercept)  2.1000444  2.0863641   1.007    0.318
winter_year -0.0008952  0.0010542  -0.849    0.399

Residual standard error: 0.145 on 59 degrees of freedom
Multiple R-squared: 0.01208,    Adjusted R-squared: -0.004669
F-statistic: 0.7211 on 1 and 59 DF,  p-value: 0.3992
What does this mean? Well, there’s no statistically significant relationship between year or ONI and the amount of snow that falls over the course of a Fairbanks winter. I ran the same analysis against precipitation data and got the same non-result. This doesn’t necessarily mean there isn’t a relationship, just that my analysis didn’t have the ability to find it. Perhaps aggregating all the data into a six month “winter” was a mistake, or there’s some temporal offset between colder ocean temperatures and increased precipitation in Fairbanks. Or maybe La Niña really doesn’t affect precipitation in Fairbanks like it does in Oregon and Washington.
Bummer. The good news is that the analysis didn’t show La Niña is associated with lower snowfall in Fairbanks, so we can still hope for a high snow year. We just can’t hang those hopes on La Niña, should it come to pass.
Since I’ve already got the data, I wanted to test the hypothesis that a low ONI (a La Niña year) is related to colder winter temperatures in Fairbanks. Here’s that analysis performed against the average minimum temperature in Fairbanks (similar results were found with maximum and average temperature):
R> model <- lm(t_min ~ winter_year + nino_index, data = result)
R> summary(model)

Call:
lm(formula = t_min ~ winter_year + nino_index, data = result)

Residuals:
     Min       1Q   Median       3Q      Max
-10.5987  -3.0283  -0.8838   3.0117  10.9808

Coefficients:
              Estimate Std. Error t value Pr(>|t|)
(Intercept) -209.07111   70.19056  -2.979  0.00422 **
winter_year    0.10278    0.03547   2.898  0.00529 **
nino_index     1.71415    0.68388   2.506  0.01502 *
—
Signif. codes:  0 ‘***’ 0.001 ‘**’ 0.01 ‘*’ 0.05 ‘.’ 0.1 ‘ ’ 1

Residual standard error: 4.802 on 58 degrees of freedom
Multiple R-squared: 0.2343,     Adjusted R-squared: 0.2079
F-statistic: 8.874 on 2 and 58 DF,  p-value: 0.0004343
The results of the analysis show a significant relationship between ONI index and the average minimum temperature in Fairbanks. The relationship is positive, which means that when the ONI index is low (La Niña), winter temperatures in Fairbanks will be colder. In addition, there’s a strong (and significant) positive relationship between year and temperature, indicating that winter temperatures in Fairbanks have increased by an average of 0.1 degrees per year over the period between 1950 and 2009. This is a local result and can’t really speak to hypotheses regarding global climate change, but it does support the idea that the effect of global climate change is increasing winter temperatures in our area.
One other note: the model that includes both year and ONI, while significant, explains a little over 20% of the variation in winter temperature. There’s a lot more going on (including simple randomness) in Fairbanks winter temperature than these two variables. Still, it’s a good bet that we’re going to have a cold winter if La Niña materializes.
Thanks to Rich and his blog for provoking an interest in how El Niño/La Niña might affect us in Fairbanks.
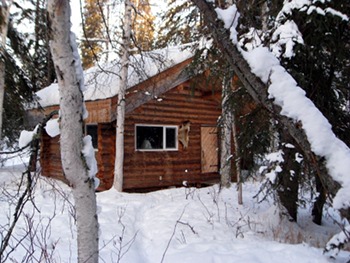
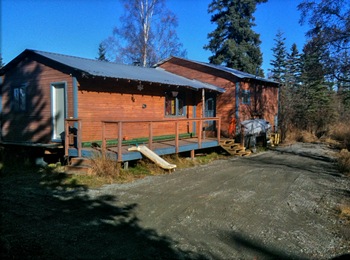
The cabin renovation is basically finished. It took much longer than I expected, but I don’t think we’ll have too much trouble finding a renter before winter really starts.
The last thing we had done was to have the utility pole straightened and the power and phone cables buried from the pole to the house. When we bought the place, the utility pole had been forced out of the ground about four feet and was leaning at least 30 degrees. In addition, the overhead lines from that pole to the house dropped to within a few feet of the ground, and were connected to a second pole that was leaning in a tree. We decided it’d be better to just bury the whole thing past the service drop. Problem was, the day before the work was scheduled, we got 0.8” of rain and when they ran the trencher through the saturated permafrost, it turned the trench into a riverine mud pit. The trench ran right along the cabin, and essentially ruined the front yard and driveway area. Since I was having gravel delivered for our arctic entryway, I decided to get a full truck and have them deliver the extra to the cabin. It’s still a bit of a mess, but I’m hoping that grass and other vegetation will grow up through the gravel where our renters don’t drive on it.
A series of photos taken during the entire renovation can be viewed at Cabin Renovation, Summer 2010.


